Probability Theory: Definition, Misconceptions, and Importance
- Guide Authored by Corin B. Arenas, published on September 24, 2019
Ever thought about your chances of winning the lottery? How about the likelihood of a shark attack? These situations are perfect examples for measuring probability.
Read on to learn more about the probability theory, how it impacts events, and other interesting facts you probably don’t know yet about the concept.
What is Probability?
Probability measures the likelihood that a possible, but not guaranteed event, will happen.
The probability theory is a branch of mathematics that focuses on the analysis of random events. According to Britannica, the outcome of a random occurrence cannot be predicted before it occurs. However, it may be any one of possible outcomes. The actual outcome is deemed to be determined by chance.
Who began the study?
The idea of probability as a useful science is ascribed to French mathematicians Blaise Pascal and Pierre de Fermat.
According Calculus, Volume II by Tom M. Apostol, Pascal and de Fermat were solving a gambling problem in 1654. They were figuring out the number of turns needed to obtain a 6 while rolling 2 dices. Pascal and de Fermat’s discussions laid out the groundwork for the concept of the probability theory.
Why is probability important?
Based on logical factors, it allows us to know if an event will have a high or low chance of occurring. The study also tells if the event is independent or dependent of previous occurrences.
This calculation is useful for determining the likelihood of all sorts of events in advance, from something as simple as rolling the number 6 on a dice, to practical matters like determining when mortgage rates are likely to fall. It also helps doctors measure life expectancy in a group of adults, and the rate of genetic disease occurring in a newborn child.
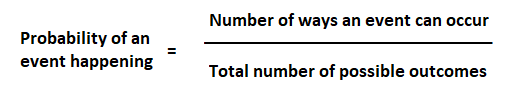
The Probability Formula
The probability formula is the ratio of the number of ways an event can occur (favorable outcomes) over the total number of possible outcomes. See the basic formula below.
Here’s a simple example: What’s the probability of getting a 6 when you roll a dice?
Examine the factors. A dice is a cube with 6 sides, and 1 side contains the number 6. This gives us 1 favorable outcome over a total of 6 possible outcomes.
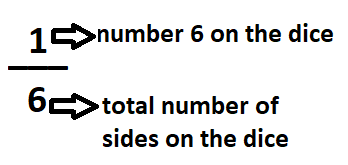
Probability of an event = 1/6
= 0.1666666666666667
The calculation shows the probability is low.
Here is the standard formula for the probability of an event to occur:
P(A) = n(A) / n(S)
For the equation above:
- P(A) stands for the probability of an event happening
- n(A) stands for the number of ways an event can happen
- n(S) stands for the total number of possible outcomes
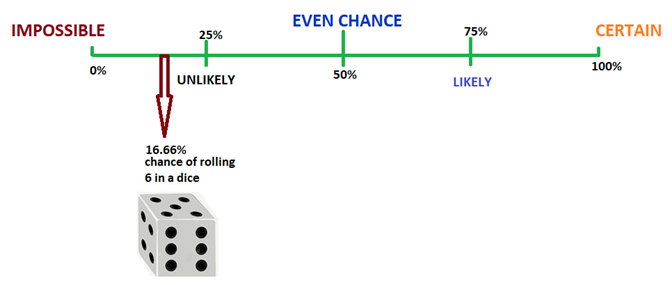
The probability of one event occurring is quantified as a number between 0 and 1, with 1 representing certainty, and 0 representing that the event cannot happen.
Therefore, the probability of an event lies between 0 ≤ P(A) ≤ 1.
If we plot the likelihood of rolling a 6 on a dice in the probability line, it would look something like this:
What’s the formula for an event that will not occur? If the probability of an event occurring is P(A), and the probability of an event not occurring is 1 – P(A), then P(A’) signifies the event cannot occur.
P(A’) = 1 – P(A)
Types of Events That Influence Probability
Picking a card, tossing a coin, and rolling a dice are all random events. But in the study of probability, there are at least 3 types of events which impact outcome:
- Independent
- Dependent
- Mutually exclusive
Independent
In this type of event, each occurrence is not influenced at all by other events.
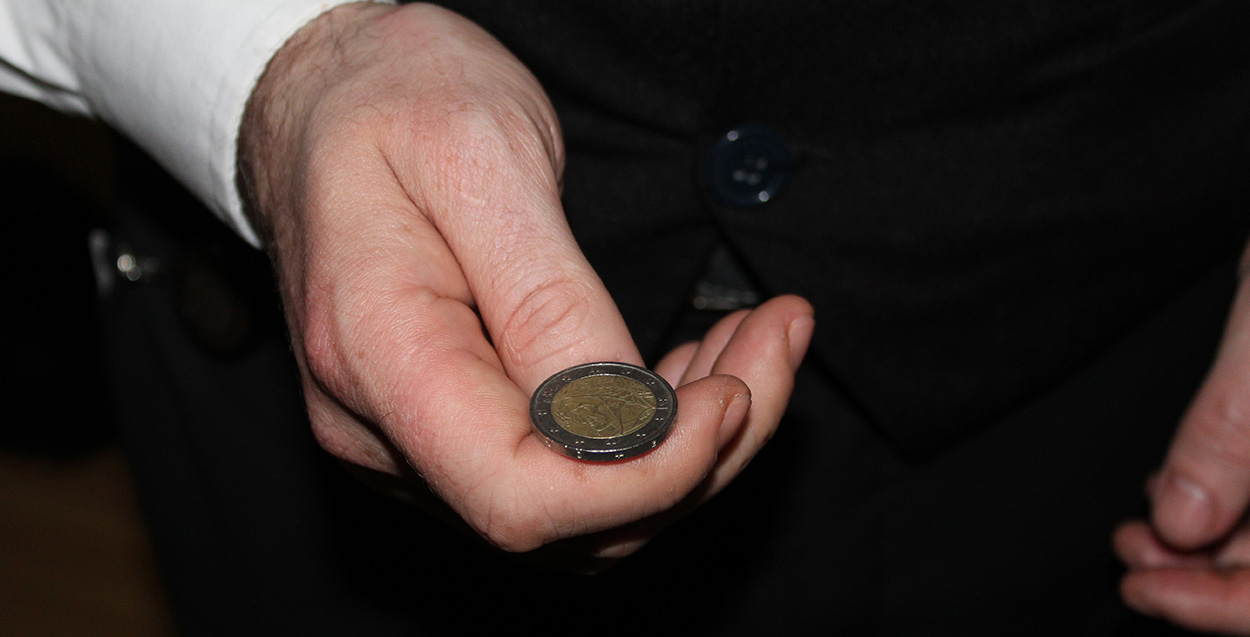
An example is tossing a coin to get heads or tails. Each coin toss is an independent event, which means the previous coin tosses do not matter. The chances of getting heads or tails is 1/2 or 50% every time a coin is tossed. Likewise, each time dice is rolled whatever was rolled on the previous roll has no impact on subsequent rolls.
Dependent

This is when the outcome is influenced by other events, also called ‘conditional’ event. And if two events are dependent events, one event affects the probability of another event.
An example is drawing cards. Every time you take a card, the number of cards decrease (there are 52 cards in a deck), which means the probabilities change. For instance, the chance of getting a king is 4 out of 52 on your first draw. If you get a king on your first card, the second card will have a lower chance of being a king, and the probability becomes 3 out of 51.
Mutually Exclusive
These are events that cannot happen at the same time. One event occurs or the other, but never both. Examples of this include a coin toss and turning left or right.
In a deck of cards, aces and kings are mutually exclusive, because both group of cards are entirely different from each other. On the other hand, heart cards and kings are not mutually exclusive because the group includes the king of hearts.
Common Misconceptions with Probability
It’s important to focus on logical factors when it comes to estimating probability. However, people are prone to believe logical fallacies which affect how they perceive and analyze information.
Take note of these common misconceptions when it comes to determining probability:
Gambler’s Fallacy

This happens when a person reasons that an event is likely to happen based on a series of previous outcomes.
The misconception is also called the Monte Carlo fallacy or ‘the maturity of chances,’ according to Darrell Huff and Irving Geis’ How to Take a Chance. It was named after a casino in Las Vegas where the phenomenon was studied in 1913.
Again, a coin toss always has a 50% chance of landing on heads and tails. Each coin toss is an independent event not influenced by previous factors. It’s not logical to reason that your ‘luck’ should change if the coin lands on tails 10 times in a row. It doesn’t guarantee the coin will be a head on the 6th toss, even on the succeeding tosses.
Investors tend to make this mistake. They think a stock will lose or gain value based on previous trading sessions with the opposite trend. But the fact is that the event is independent from previous trends.
Hot Hand Fallacy
Similar to the gambler’s fallacy, the hot hand fallacy is when people make decisions based on previous events. But those who commit this mistake tend to think they are ‘lucky’ when they win a few times in a row. This makes them irrationally think they won’t lose, so they keep on betting instead of cashing in.
Again, the mistake lies in the failure recognize that the event is statistically independent from previous outcomes.
However, the hot hand fallacy has an exception, say Stanford finance professor Jeffrey Zwiebel. For events that are not purely probabilistic, such as a game of basketball or baseball, it doesn’t always apply. Although the outcome in sports can be partially attributed to probability, there is no question that skill and belief plays a great role in affecting performance.
Anchor Bias

People often rely on a reference point to make decisions. Knowing this, psychologists discovered we place too much importance on the first piece of information we find.
Anchoring or focalism is a term in psychology that describes the tendency to rely too heavily on one piece of evidence. This clouds our judgment, and again, keeps us from examining the big picture. Once an anchor is established, there is bias towards its value.
For instance, it can influence how much you’re willing to spend. If you find out the average car in the market is $27,000, you’re likely to purchase a vehicle close to this price. You might be willing to buy a car for $26,000 because it’s below the average price.
However, it’s not the best deal. If you check around, you might find the same make and model for $24,000 from a dealer across town.
Recency Bias

When people overvalue an event that happened recently, it’s called recency or availability bias.
It refers to inaccurate judgments we make as a result of letting the recency effect influence our past recollection. Quite the opposite of the gambler’s fallacy, it distorts perception without considering a larger body of evidence.
For instance, people tend to exaggerate the occurrence of shark attacks when they see it in the news. Though shark attacks are extremely rare, people irrationally think another attack will happen soon. Or perhaps we can blame the national fear of sharks on the 1975 film Jaws.
According to a report by the Los Angeles Times, a person has 0.00003% chance of being attacked by a shark. This means you’re more likely to die from heart failure (20%) than be killed by a shark.
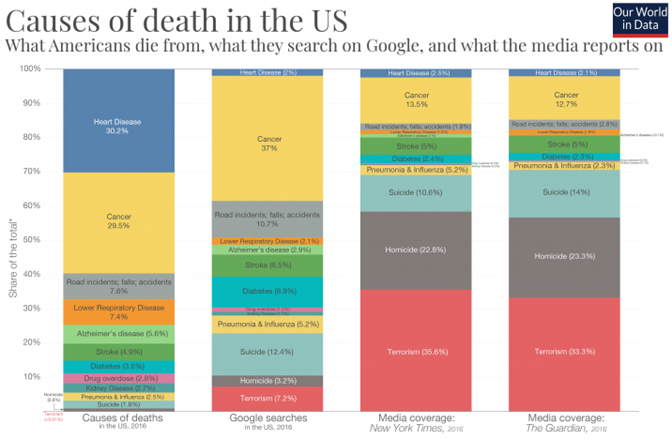
Some causes of death in the U.S. do not receive as much media coverage as they should. In a 2016 report by Our World in Data, the biggest discrepancies involve violent types of death, such as suicide, homicide, and terrorism. All three get more media coverage and Google searches than the actual percentage of deaths. See the table below.
| Causes of Death |
Actual Deaths % |
Media Coverage % |
Google Searches % |
| Heart Disease |
30.2% |
2.1-2.5% |
2% |
| Cancer |
29.5% |
12.7-13.5% |
37% |
| Road incidents; falls; accidents |
7.6% |
1.9 – 2.8% |
10.7% |
| Stroke |
4.9% |
5% |
6.5% |
| Suicide |
1.8% |
10.6 – 14% |
12.4% |
| Homicide |
0.9% |
22.8 – 23.3% |
3.2% |
| Terrorism |
<0.01% |
33.3 – 35.6% |
7.2% |
Other rare events that may seem prevalent due to media coverage:
- Plane Crashes
- School shootings
- Winning the lottery
- Nuclear power plant meltdown
- 8.0+ Richter magnitude earthquake
Probability Studies in the Modern Age
Probability is useful for determining something as simple as rolling the number 6 on a dice, to determining life expectancy in a group of adults, and the rate of genetic disease occurring in a newborn child.
Other contemporary applications of probability studies are found in astrophysics, weather prediction, medicine, music and computer programming.
Why is probability important?
Everyone benefits from knowing the likelihood of events in advance. It gives us a wider perspective into issues, which prepares to come us with effective ways to address problems.
About the Author
Corin is an ardent researcher and writer of financial topics—studying economic trends, how they affect populations, as well as how to help consumers make wiser financial decisions. Her other feature articles can be read on Inquirer.net and Manileno.com. She holds a Master’s degree in Creative Writing from the University of the Philippines, one of the top academic institutions in the world, and a Bachelor’s in Communication Arts from Miriam College.
Probability Cartoons