
 Calculate Correlation Co-efficient

Using This Calculator
Use this calculator to determine the statistical strength of relationships between two sets of numbers. Click on the "Add More" link to add more numbers to the sample dataset. The co-efficient will range between -1 and +1 with positive correlations increasing the value & negative correlations decreasing the value. The results will automatically update each additional numbers are added to the set.
Correlation Co-efficient Formula
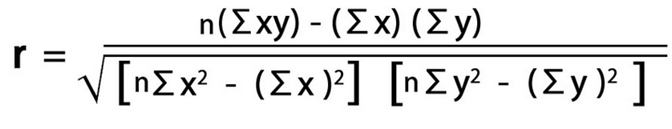
Here is the correlation co-efficient formula used by this calculator
Correlation(r) = NΣXY - (ΣX)(ΣY) / Sqrt([NΣX2 - (ΣX)2][NΣY2 - (ΣY)2])
Formula definitions
- N = number of values or elements in the set
- X = first score
- Y = second score
- ΣXY = sum of the product of both scores
- ΣX = sum of first scores
- ΣY = sum of second scores
- ΣX2 = sum of squares of first set of scores
- ΣY2 = sum of squares of second set of scores
Correlation: Definition and Importance of Proper Data Interpretation
- Guide Authored by Corin B. Arenas, published on September 25, 2019
Ever thought of how our needs impact prices? How about your stress levels in relation to your financial habits? All these are situations that require correlation analysis.
Read on to learn more about correlation, why it’s important, and how it can help you understand random connections better.
What is Correlation?

The study of how variables are related is called correlation analysis.
Correlation measures the strength of how two things are related. Britannica defines it as the degree of association between 2 random variables.
In statistics, correlational analysis is a method used to evaluate the strength of a relationship between two numerically measured, continuous variables. Unlike controlled experiments, the defining aspect of correlational studies is that neither of the variables are manipulated.
In finance, the correlation can measure the movement of a stock with that of a benchmark index.
Correlation is commonly used to test associations between quantitative variables or categorical variables. The correlation between graphs of 2 data sets signify the degree to which they are similar to each other.
Types of Variables:
- Quantitative variables – Refers to numeric data in statistics. Examples include percentage, decimals, map coordinates, rates, prices, etc.
- Categorical variables – Refers to qualitative data which are descriptions of groups or things. These are not numerical. Examples include voting preference, race, cities, hair color, favorite movie, etc.
Measuring the Strength Between 2 Variables

A correlation coefficient formula is used to determine the relationship strength between 2 continuous variables.
The formula was developed by British statistician Karl Pearson in the 1890s, which is why the value is called the Pearson correlation coefficient (r). The equation was derived from an idea proposed by statistician and sociologist Sir Francis Galton. See the formula below:
Pearson’s correlation coefficient is also known as the ‘product moment correlation coefficient’ (PMCC). It has a value between -1 and 1 where:
- A zero result signifies no relationship at all
- 1 signifies a strong positive relationship
- -1 signifies a strong negative relationship
What these results indicate:
- Zero result – It means the two variables do not have any linear relation at all. Some connection may exist between the two, but not in a linear manner.
- Positive correlation – A variable rises simultaneously with the other and moves in the same direction. High numerical figures on one set relates to high numerical figures of the other set.
- Negative correlation – A variable decreases as the other variable increases. They move in opposite directions. High numerical figures on one set relates to the low numerical figures of the other set.
When plotted in a graph, here’s how variable relationships translate visually:

Positive and Negative Numerical Relationships

When we study market trends, positive correlation is commonly found between product demand and price.
Prices increase when firms cannot produce enough supplies for the consumer’s needs. This is the fundamental concept behind the law of supply and demand. Consumer spending and gross domestic product (GDP) are two variables that maintain a positive correlation with each other.
When it comes to investments, there is a positive correlation between the amount of risk and potential for return. However, there is no guarantee that taking a higher risk will often yield greater return.
To counteract this, investments with varying levels of risk are placed together in a portfolio to diversify it. This helps maximize returns while lessening the potential for large drawdowns as volatility spikes within a particular asset class.
Here are other examples of positive correlation:
- Weight and height
- Caloric intake and weight
- Computer use and grade point average (GPA)
- Child’s eye color and relatives’ eye color
- Time of investment and compounding interests
In finance, a negative correlation or an inverse relationship occurs between investment returns of 2 different assets. A good example is negative correlation between equities and bonds. It indicates that bonds perform well when equities sell off.
However, note that the correlation between these variables is not static. Since it’s continuous, it means the correlation may shift over time, from negative to positive, and vice versa. But for majority of the time, U.S. equities and bonds have had a negative correlation since the late 1990s.
Other examples of negative correlation include:
- Amount of money earned and time spent with family
- Number of cigarettes per day and lifespan
- Cold temperatures and electricity cost (in a tropical area)
- Amount of snow fall and number of cars on the road
- Positive behavior in healthcare professionals and patient mortality rates
- Positive financial habits and level of stress
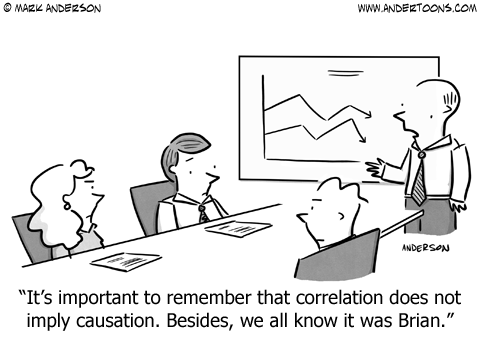
Correlation vs. Causation
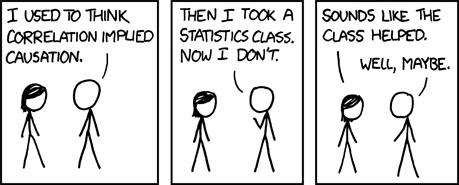
via XKCD
Correlational research models do not always indicate causal relationships.
Knowing that two variables are associated does not automatically mean one causes the other. A correlational link between two variables may simply report that their trend moves in a synchronized manner.
For a causal relationship to occur, a variable must directly cause the other.

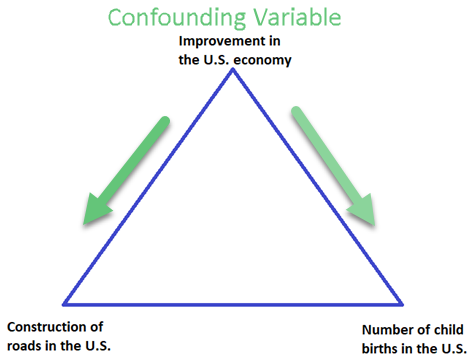
For instance, we might establish there is a correlation between the number of roads built in the U.S. and the number of children born in the U.S. While we might see more roads being constructed and more children are being born, it does not mean the relationship is a causal one.
It leads us to consider a third hidden variable which directly affects the behavior of the two variables. If a researcher is unaware of this confounding variable, they may interpret the data incorrectly.
For this example, people might think the construction of roads causes the birth of more children. It’s a ridiculous assumption, one that’s often made fun of at the Spurious Correlations site.
If we think about it, the third variable causing more road constructions and child births can be attributed to the general improvement of the U.S. economy.
Flawed Research Models and Correlational Interpretations
A 2015 article in the American Scientist pointed out how misinterpretation of correlations can render research papers inaccurate and useless. It can also be dangerously misleading to medical practitioners and the public.

The story referred to a 2012 study published in the New England Journal of Medicine, claiming that chocolate consumption could boost cognitive function. Again, the correlation did not account for the nature of the quantitative link. It only presented strong similarities between the variables.
If peer reviewed journals overlook flaws in research methods and interpretation, what more with general biomedical news? The incident alarmed medical and scientific communities, calling for proper research parameters to prevent the spread of misleading information.
However, even when experts criticized the study, many news outlets still reported its findings. The paper was never retracted and has been cited several times.
It calls to mind how George E.P. Box described statistical models as oversimplifications of reality:
“Essentially, all [statistical] models are wrong, but some are useful.”
-George E. P. Box, ‘Empirical Model Building and Response Surfaces’
The Takeaway
"etc_correlation50__01__960"by kohane is licensed under CC BY-NC 2.0![]()
![]()
![]()
Knowing the right way to use correlations can help pinpoint what connects two variables. This in turn helps predict future trends based on the patterns they create.
However, careless use of correlation can be misleading to the public. Which is why it’s important to set proper research models before using correlations to justify a study.
Correlation analysis is crucial for all sorts of fields, such as government and health care sectors. Companies also use correlations to analyze budgets and create effective business plans.
About the Author
Corin is an ardent researcher and writer of financial topics—studying economic trends, how they affect populations, as well as how to help consumers make wiser financial decisions. Her other feature articles can be read on Inquirer.net and Manileno.com. She holds a Master’s degree in Creative Writing from the University of the Philippines, one of the top academic institutions in the world, and a Bachelor’s in Communication Arts from Miriam College.
Brian
This calculator does not attempt to account for Brian. :)
Play & Learn